
Jakob Sverre Løvstad
CTO, Seema
6 August 2025
A question I sometimes get when I teach about stereotypes and prejudices is "where do they come from?". In purely neuropsychological terms, we will always experience a reaction to everything the brain observes as different, but this does not mean that we have a specific conviction about the group we assume the person who is different belongs to. Put simply: Just because you hear an Ålesund dialect, it doesn't automatically make sense to think "Sunnmøre people are stingy". Of course, you could think many other things, but it's a myth that exists and thus what you hear (i.e. the dialect) is linked to something you "know".
So where do these assumptions come from?
Here it is once again natural to refer to Gordon Allport, who describes four key (and fortunately simple) statistical phenomena that lead to people having certain types of thoughts/opinions/feelings about different groups. Remember that everything that follows is about how we make assumptions about groups, but the whole point is that it doesn't mean those assumptions are correct. These are "eye of the beholder" type phenomena.
J-curves with conforming behaviour:
J-curves are a reference to so-called frequency curves shaped like a "J" where a group exhibits a behaviour that most people follow, as in the following hypothetical curve for 17 May celebrations in Norway (loosely based on a survey conducted by Dagbladet in 2013):
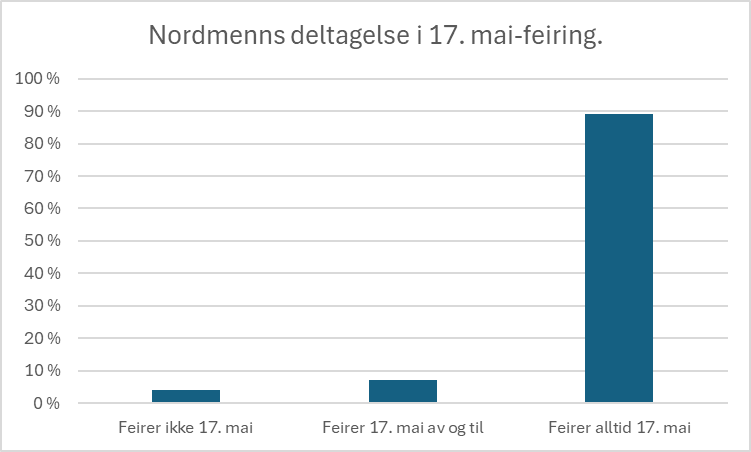
The main point is that the J-curve describes how the behaviour is within a given group. The 17th May celebrations are of very little relevance to a Greek who lives in Athens and has no relation to Norway. So the very fact that you are part of the conformity-created behaviour described by the J-curve becomes an identifier. You can then say in practice that "Norwegians are the kind of people who follow the J-curve for 17 May celebrations". This creates an idea of what it means to be Norwegian in the eyes of outsiders.
Rare zero differential ("rare-zero differential")
This describes a phenomenon where a few people in a group practice a behaviour or have a trait that is non-existent in other groups. In other words, outsiders think that there is something special about a group, even though it applies to very few people in the group. A simple example is Scots and the wearing of kilts. For most people in Scotland, the kilt is only worn on special occasions (if at all), but at the same time it is only very rarely worn by others. In other words, you can get the idea that "Scots are like that in kilts", even though the point prevalence at any given time is fairly low - because it is close to zero in others. The result is a somewhat fictitious distinction based on exceptional phenomena.
Overlapping normal distributions
For a number of human characteristics, we see that we get a normal distribution that describes how many people have a degree of whatever it is we are measuring. Common examples are personality and cognitive ability. And if you then divide these measurements by gender, for example, you will get overlapping normal distributions where there is also a difference in mean and standard deviation. In other words, something like this:
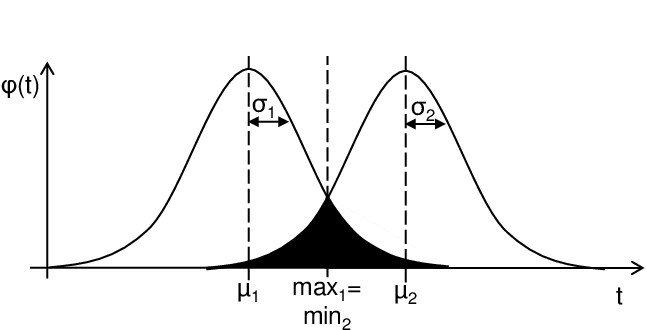
If we look at, just to take one example, the article "Gender Differences in Personality across the Ten Aspects of the Big Five" (Weisberg, DeYoung and Hirsh, 2011), you will see a number of differences in personality traits. As in several other studies, we see a higher neuroticism in women than men (Cohen's d ~ 0.39) and also higher care (Cohen's d ~ 0.45), with some associated difference in kurtosis. It's easy to come up with the platitude "women are volatile and caring" - an idea that has been widely used as a gender differentiator over the years.
And so normal distributions and effect sizes are used for very simplistic myths about groups in many contexts, without fully understanding the nuances of statistics or behavioural adaptations of the traits.
Categorical differences
In some contexts, it is simply found that there is more/less of something in one group versus another group. For example, it is assumed that the prevalence of alcohol use disorder in Norway is somewhere around 5-8%while in Russia is considered to be 7-12%. Such a difference can become a source of a way of thinking about differences between the two countries, with associated assumptions about population groups. In Norway, one might think of Russians as "Boris Yeltsin" types who are never far from a vodka bottle, despite the fact that the percentage difference is not currently enormous.
Summarised
As I like to say, stereotypes and prejudices come from somewhere and can be true or false to varying degrees. Given the statistical starting point, you always have to go a couple of rounds and investigate "what's really the deal" when you hear about a given assumption about a group of people, and then you will eventually end up with a nuanced basis for discussing whatever it is that is an assumed group differentiator. The important thing is to keep a cool head and look carefully at what is actually the case, rather than getting an estimate in one direction or another.